Spectral Analysis
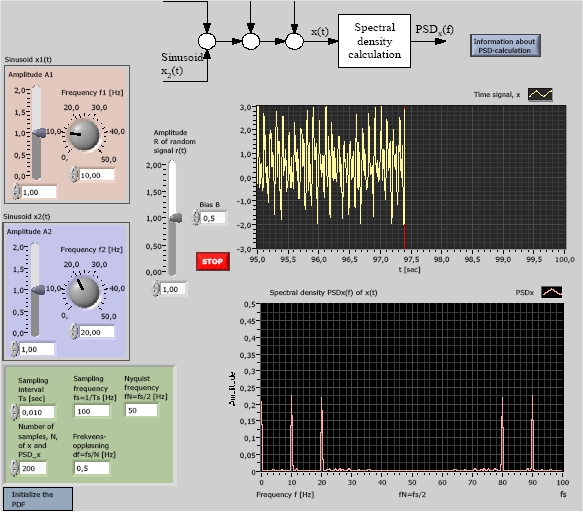
Snapshot of the front panel of the simulator:

- What is needed to run the the simulator? Read to get most recent information!
- Tips for using the simulator.
- The simulator: spectral_analysis.zip (unzip, and open spectral_analysis.exe)
Description of the simulated system
There are several functions or algorithms for calculation of spectral information. One widely used function is the power spectral density (PSD), which is the square of the mean absolute value of the discrete-time Fourier transform (DFT) of the signal:
PSDx(f) = (|DFTx|/N)2
where f is the frequency in Hz. f is actually a discrete frequency given by
fk = df*k
where k is a frequency index: k = 0,..,N-1, where N is the number of samples of the time series (signal) x. The frequency resolution or frequency increment df is
df = fs/N
where fs is the sampling frequency [Hz] given by
fs = 1/Ts
where Ts is the sampling interval.
PSD (and DFT) gives spectral information only for the frequency range from 0 up to the Nyquist frequency fN defined as half the sampling frequency:
fN = fs/2
PSD also gives spectral information in the frequency range larger than fN, i.e. from fN to fs, but this information is equal to the spectral information for the frequency range from 0 to fN - but mirrored.
Since DFT, and hence the PSD, is calculated from a number of samples of the signal x random noise in the signal is averaged, and hence the effect of such noise on the calculation of PSD is averaged (out). This implies that the PSD is able to show the spectral contents of very noisy signals.
In the simulator the signal x for which the PSD is calculated, is a sum of the following four signals: Two sinusoids, x1 and x2, a uniformly distributed random signal r, and a bias (constant signal) of value B:
x = x1 + x2 + r + B
The random component may represent measurement noise.
What is the PSD of a sinusoid and of a constant signal (both are components of the signal x used in the simulator)? It can be shown that a sinusoid of amplitude A and frequency f1 have PSD of value
A2/4
at the frequency f1 (and the same value at the mirrored frequency fs - f1), and zero PSD at other frequencies. This can be used to calculate the amplitude and the frequency of an assumed sinusoid. Thus, a sinusoid appears as a spike at frequency f1 in a PSD plot).
It can also be shown that a constant signal of value B has PSD value B2 at frequency 0 and PSD value 0 at other frequencies.
In the simulator PSD is calculated using the LabVIEW function Power Spectrum PtByPt (Point-by-point).
Motivation
Spectral analysis is used to show the frequency - or spectral - contents of a signal. One important appliaction is detection of vibrations of machine bearings.
Tasks
Run the simulator. Unless otherwise stated the random signal r can be suppressed (by setting the maximum amplitude R equal to 0). Also the bias can be suppressed (with B = 0).
- Detection of freuqncy components:
Choose by yourself the amplitude and the frequency of each of the two sinusoidal
signal components. Are these two components indicated clearly by the PSD
plot? What are the frequecies and amplitudes as seen from the PSD plot?
Are the PSD results correct?
- Detection of a bias (constant signal):
Select a value of B different from zero, e.g. B = 0.5. Is the bias
indicated by the PSD plot? Does the PSD plot give correct information
about the B value?
- The impact of random noise: As
Task 1, but add a significant (large) noise component, r. For example,
you can set R equal to the largest amplitude of the two sinusoids (you
can choose these amplitudes yourself). Is the PSD plot able to detect
the two sinusoids? How does the ability of the PSD for expressing the
frequency components depend on the number of samples, N?
- Note: Aliasing! As you probably
know, cf. the aliasing simulator a signal
of frequency fsignal larger than the Nyquist frequency is
aliased to a frequency falias which is equal to the
difference between the signal frequency fsignal and the sampling
frequency fs, i.e.
falias = fs - fsignal
If the PSD is calculated from the resulting (aliased) signal the PSD will of course indicate the frequency of this signal, and not the frequency of the original signal.
Let the signal x1 have frequency 8Hz (you can suppress the signals x2 and r and also the bias). Set the sampling frequency to 10Hz (i.e. the sampling interval is 0.1s). According to the facts presented above (in this subtask), what is the falias? Is this result confirmed by the PSD plot?
Updated 2 September 2017. Developed by Finn Haugen. E-mail: finn@techteach.no.
