![]()
Correlation
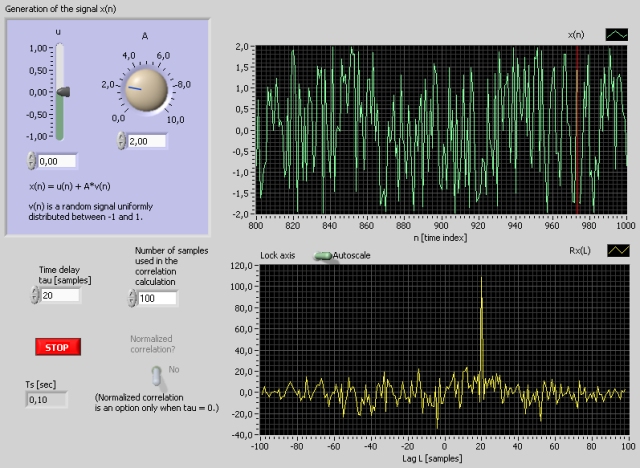
Snapshot of the front panel of the simulator:
- What is needed to run the the simulator? Read to get most recent information!
- Tips for using the simulator.
- The simulator: correlation.exe . The simulator runs immediately after the download by clicking Open in the download window. Alternatively, you can first save a copy of the exe-file on any directory (folder) on your PC and then run the exe-file, which starts the simulator.
Description of the system to be simulated
The user can generate a signal x(n) as sum of a constant (or bias) and a random signal. The auto correlation of x(n) is calculated in real time based on a number of samples (of historical data) defined by the user.
The user can also introduce a lag L [samples] between signals. The cross correlation of the signal and the delayed signal is computed.
Aims
The aims of this simulator is as follows:
- How the correlation function works
- How the correlation function represents random signals
- How the cross correlation function represents a time delay between random signals
Motivation
The autocorrelation of a signal can be used to express the random character of a signal.
The cross correlation can be used to detect a time delay between two signals.
Tasks
Initially, choose
- non-normalized correlation
- zero lag between the signals (time series)
- Auto correlation of a constant signal:
Let x(n) be a constant.
- Use a non-normalized correlation function. What is the value of the correlation Rx(0)? Could you have calculated Rx(0) in advance?
- Can you from the shown Rx(L) in the simulator determine which kind of correlation the correlation function implemented in LabVIEW implements? (Is there avaraging, i.e. division by number of samples N? Is there a compensation in the correlation function for large L-values?)
- Auto correlation of a random signal:
Let x(n) be a pure random signal with zero mean.
- Does the form of the correlation function Rx(L) indicate that the signal is ransom (with zero bias)?
- Use a normalized correlation function Rx. Describe the difference between this Rx and the non-normalized correlation?
- Does Rx clearly express the dandomness of a signal if the number of samples of the signal of which the correlation function is calculated, is small?
- Select non-normalized correlation. Read off the energy of x from the correlation function.
- Correlation of lagged random signals:
Let x(n) be a random signal with zero mean. Introduce some lag in the
signal. Use non-normalized correlation. The correlation is now being
calculated between x(n) and x(n-L).
- In which way is the lag expressed by the correlation function? (You may try with different lags.)
Updated 2 September 2017. Developed by Finn Haugen. E-mail: finn@techteach.no.