![]()
SEQUENTIAL CONTROL OF A BATCH PROCESS
- Picture of the frontpanel of the simulator
- What is needed to run the the simulator? Read to get most recent information!
- Tips for using the simulator.
- The simulator: sequential_control.exe (click to download). The simulator runs immediately after the download by clicking Open in the download window. Alternatively, you can first save a copy of the exe-file on any directory (folder) on your PC and then run the exe-file, which starts the simulator.
Description of the system to be simulated
This simulator simulates a sequential control system for a simple batch process. A tank is filled with water. The water is then heated and stirred, and finally the heated water is discharged from ther tank.
The simulator is based on the following mathematical model of the process (the individual parameters are defined on the front panel of the simulator):
dh/dt=(1/rho)*(1/A)*[K_in*u_valve_in-K_out*u_valve_out]
which is based on mass balance, and
dT/dt=[1/(c*rho*A*h)]*[K_heat*u_heat+(T_in-T)*c*w_in+(T_env-T)*U]
which is based on energy balance. There is a time-delay in the temperature measurement.
A stirring motor is controlled by the control signal
u_motor
The motor is assumed to ensure homogenuous thermal conditions in the water in the tank.
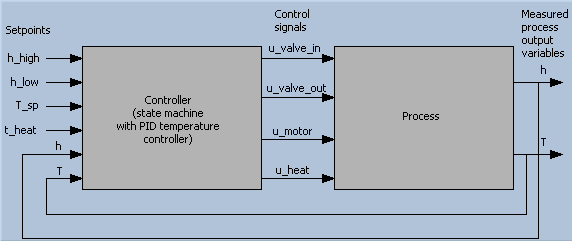
The control signals are
-
u_valve_in (boolean, i.e. having value TRUE or FALSE, or ON or OFF)
-
u_valve_out (boolean)
-
u_motor (boolean)
-
u_heat (continuous having any value between 0% and 100%)
The measurements are
-
Temperature T of the water in the tank
-
Level h of the water in the tank
The figure below shows an overall block diagram of the control system.
Aim
The aim of the tasks below is to develop a better understanding of sequential control, and using a state diagram.
Motivation
Sequential control is crucial in many control applications, as in chemical batch processes.
A sequential control procedure can be represented graphically by one of the following two methods:
- A state diagram, also denoted a state machine
- A sequential flow chart (SFC)
State diagrams and SFC are quite similar, as they have the same basic elements:
- States with actions to be executed when the state is active
- Transitions from one active state to another taking place if the transition condition is logically true.
Controllers can be implemented using graphical programming of state diagrams or SFCs in proper programming tools. For example, state diagrams are supported by the State Diagram Toolkit in LabVIEW, and HiGraph in the Step 7 programming tools of Simatic PLCs, while SFC is supported by the GX IEC Developer programming tool of Mitsubishi FX2N PLCs.
Tasks
- Run the simulator, and make sure you understand how the control system works.
- Draw a detailed state diagram of the sequential control system. The actions in every state must be defined, and the transition conditions in every transition must be defined. For your information: Introduction to state diagrams.
April 27, 2005. Developed by Finn Haugen. E-mail: finn@techteach.no.